Global Liquidity Map 2025: RRP1, TGA2, QT3 & Märkte
Global Liquidity Map 2025: RRP1, TGA2, QT3 & Märkte
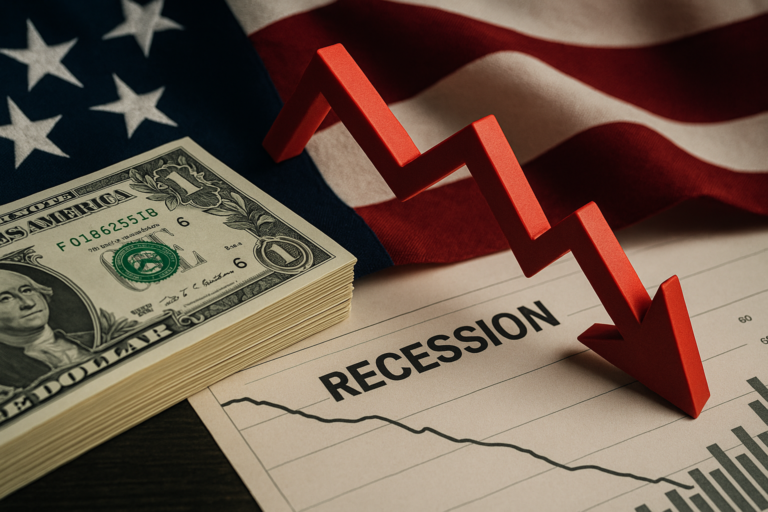
B in longs liquidated · CoinDesk Why Bitcoin, XRP, Solana, and Ether slide as gold and silver soar · CoinDesk Dollar headed for weekly loss as investors await US data backlog · Reuters Stocks crumble as hopes fade for imminent Fed rate cut · Reuters Gold rises, poised for weekly gain on softer dollar · Reuters Bitcoin ETF Outflows HitGlobal Liquidity Map 2025: RRP1, TGA2, QT3 & Märkte
.2B Even as Wall Street Deepens Its Crypto Bets · CoinDesk Asia Morning Briefing: Bitcoin Rebounds as Polymarket Traders Bet U.S. Shutdown Will End Within Days · CoinDesk Asia refining margins soar as sanctions threaten Russian supplies · Reuters Investors anticipate new wave of Argentine reforms after Milei's midterm victory · Reuters End of Fed QT may offer Treasury convenient buffer · Reuters Stock Market Today: Dow, S&P Live Updates for Oct. 28 · Bloomberg Ceconomy, takeover target of JD.com, says it will exceed annual profit forecast · ReutersLiquidity is the market’s invisible metronome. In 2025, direction is shaped by three US gears—Quantitative Tightening (QT) by the Federal Reserve, usage of the Overnight Reverse Repo Facility (RRP), and the Treasury General Account (TGA)—alongside balance-sheet paths at the ECB, BoE, and BoJ. This deep dive explains the mechanics, why net liquidity matters for risk assets, and what this means for bonds, equities, and crypto.
Global Liquidity Map 2025
1) “Net Liquidity” — a practical heuristic
Unter Tradern hat sich die Heuristik etabliert: Net Liquidity ≈ Fed4-Bilanz – RRP – TGA. Das ist kein offizielles geldpolitisches Ziel, hilft aber, Veränderungen der Bankreserven grob zu proxen. Fallen RRP-Bestände (weniger Cash wird bei der Fed geparkt) oder sinkt der TGA (Staatskasse gibt Mittel aus), steigt ceteris paribus die Reservebasis des Bankensystems. Umgekehrt entziehen hoher TGA oder steigende Bilanzreduktion (QT) Reserven – ein Liquiditäts-„Drain“.
2) United States: QT, RRP, TGA — how the gears mesh
QT shrinks the Fed’s balance sheet, increasing the net supply of duration to markets. At the same time, RRP usage fell sharply through 2025—money market funds park less cash at the Fed, which supports reserves. The TGA oscillates with taxes, auctions, and cash-management needs: builds withdraw reserves from the banking system; drawdowns add them back. What matters is the net effect of all three gears rather than any one in isolation.
3) Europe & UK: APP/PEPP runoff and active gilt sales
In the euro area, the APP and PEPP portfolios are running off without reinvestments. That mechanically reduces structural central-bank demand for sovereign bonds and can support the term premium. The Bank of England continues active gilt sales. Both paths reduce the presence of central banks as large buyers and shift the supply-demand balance toward higher yields—especially at the long end.
4) Japan: BoJ between normalization and stability
The Bank of Japan is gradually dialing down its JGB purchases. A long-standing global dampener on high-duration yields thus becomes less forceful. For global investors, the marginal buyer of long duration is more selective, while FX and hedging costs matter more. An abrupt BoJ pivot is unlikely, but the direction points to cautious normalization.
5) Transmission: from reserves to yields, spreads & multiples
Liquidity impulses travel through several channels. First, the net supply of long sovereign bonds shapes the term premium and the curve. Second, credit spreads react to 2025/26 refinancing walls, primary-market liquidity, and money-market stress. Third, equity valuations (multiples) often track the global liquidity beat; in crypto, ETF flows and dollar liquidity influence risk appetite. Causality isn’t always clean, but correlations are robust enough to serve as a navigation aid.
6) Scenarios (12–18 months)
- Base case: QT continues at a slower pace; RRP remains low; TGA fluctuates around elevated targets. Yields stay high, volatility moderate, and risk assets remain selectively resilient.
- Risk case: A fiscal/emission shock, geopolitical escalation, or bank-funding stress lifts term premia, widens spreads, and pressures risk assets.
- Upside case: A productivity boost (AI, energy efficiency, re-shoring) plus more disciplined budgets compresses risk premia, supports multiples, and eases bond markets.
7) Investor playbook: turning theory into practice
In liquidity regimes, quality beats leverage. On the fixed-income side, use flexible duration management, add inflation-linked components, and favor issuers with solid interest coverage. In equities, resilient cash flows and pricing power support endurance. Crypto—if used at all—fits as a small satellite for diversification. Core principles: maintain liquidity buffers for stress, rebalance actively, and track RRP/TGA/QT as data-driven inputs.
8) Monitoring & data setup (practical)
- RRP (daily): Track the overnight RRP series relative to money-market rates and ETF flows.
- TGA (weekly/monthly): Watch cash targets, tax dates, and refunding windows; builds are reserve-negative.
- QT & auctions: Follow Treasury refunding plans, net duration supply by tenor, and primary-market coverage ratios.
- Yield curve & term premium: Map long-end moves against auction calendars and central-bank balance-sheet paths.
- Credit & funding: Monitor spreads, CDS indices, commercial-paper and repo rates as early stress indicators.
FAQ
Is “Net Liquidity” an official metric?
No. It’s a market heuristic (Fed balance sheet minus RRP minus TGA) that approximates changes in bank reserves. It doesn’t explain everything, but it’s a useful compass.
Why is low RRP usage often seen as bullish?
Because less excess cash is parked at the Fed. That can imply more reserves in the banking system and more risk appetite—though there’s no guarantee.
Why does a high TGA drain liquidity?
When the TGA builds, cash moves from the banking system to the Treasury. Drawdowns reverse that effect. Both act directly on the reserve base.
How do I implement this in a portfolio?
Emphasize quality, flexible duration, sufficient liquidity buffers, and clear rebalancing rules. A small, well-sized diversification satellite (e.g., commodities/crypto) can be helpful.
Sources & further links
- Fed H.4.1 (aktuell): federalreserve.gov/releases/h41/current/
- Fed Monetary Policy Report 2025 (Bilanz/QT): Juni 2025 MPR · Feb 2025 MPR
- Policy Normalization (QT-Leitplanken): policy-normalization.htm
- RRP Zeitreihe (FRED): RRPONTSYD
- TGA Zeitreihen (FRED): TREASURY (Monthly) · WTREGEN (Weekly)
- Treasury Quarterly Refunding (aktuell): Most Recent Documents
- EZB – APP/PEPP Informationen: ecb.europa.eu/…/pepp
- BoE – Asset Purchase Facility: APF Quarterly Report
- BoJ – Geldpolitische Beschlüsse/Minutes: MPM Statements 2025
- Weitere Deep Research Artikel
Legende (DE/EN)
- RRP (ON RRP) – Overnight Reverse Repo Facility: Tagesgeld-Einlagefazilität der Fed für Geldmarktfonds/Dealer. ↩︎
- Treasury General Account: Staatskasse der USA bei der Fed (Konto des US-Finanzministeriums). ↩︎
- Quantitative Tightening: Bilanzverkürzung der Notenbank (verfallende Anleihen, weniger Reinvestments).
QE – Quantitative Easing: Bilanzausweitung durch Wertpapierkäufe/Reinvestments. ↩︎ - Federal Reserve System (US-Notenbank). ↩︎